
In the machine learning industry, the quality of data annotation is not just a technical detail. It is the foundation on which models are built that affect disease diagnostics, the autonomy of transport systems, content recommendations, and much more. Bad annotation can “bring down” the most expensive model, no matter how complex its architecture.
This is why data annotation quality is becoming a key element in the ML development chain. Companies working with large volumes of training data feel this especially acutely in practice. Hypothesis-level examples are not what customers want to see. They need a stable, reproducible metric. And here, the quality of annotation is not just a word but a verifiable and manageable value that requires a systematic approach.
Why Quality Assurance Matters in Data Annotation
Data labeling seems like a simple process — put a label, circle an object, classify a piece of text. But it is at this stage that the model’s understanding of the world is formed. Any mistake, carelessness, or subtle contradiction between labelers can result in the AI “learning” from a distorted picture. This challenge becomes even more complex as datasets grow, which is why teams need a structured approach to scaling data annotation without sacrificing quality or speed.
How It Impacts AI Model Performance
In projects where accuracy is critical — for example, when detecting tumors in MRI images or in automatic braking systems in cars — the consequences of poor-quality annotation can be catastrophic.
In practice, the quality of annotation affects:
- the overall accuracy of the model (remember garbage in — garbage out);
- the speed and stability of training;
- the objectivity of metrics during A/B tests;
- backward compatibility when scaling;
- reputational and legal risks.
What is Quality in Data Annotation?
When it comes to machine learning, the concept of “data annotation quality” goes beyond simple accuracy. It is a multifaceted and critical concept that affects the effectiveness of the entire model. Annotation quality determines how well an AI can interpret reality and apply the acquired knowledge in practice. Let’s look at what “quality” actually means in the context of data annotation and what criteria it includes.
Definition of Quality in This Context
The quality of data labeling is the degree to which annotated data meets expectations, goals, and standards. In other words, it is a set of characteristics that ensure the accuracy, interpretability, and reproducibility of labels that are then used to train AI models.
Good labeling:
- reflects the true properties or classes of objects;
- is interpreted in the same way by different experts;
- does not contain gaps or redundant elements;
- fits the format and requirements of ML algorithms.
More formally, the quality of annotation is compliance with three main criteria: accuracy, consistency, and completeness. Each of them plays a unique role and affects the overall result.
Importance of Accuracy, Consistency, and Completeness
Accuracy is the level of correctness of the labels compared to the “true” value (the reference or expert opinion). For example, if, in an image classification task, the object dog is labeled as a cat, this error skews the training set. Even one percent of inaccurate labeling can significantly reduce the final accuracy of the model.
Accuracy errors are most often due to:
- lack of knowledge of the annotator;
- poor instructions;
- haste or fatigue.
Example: in the medical annotation of MRI images, even a small error in the boundaries of a tumor can lead to incorrect training of the model, which is potentially dangerous for the patient.
Consistency means that the same objects are labeled the same way regardless of the annotator or time. If two annotators interpret the same text differently — for example, one labels a phrase as “positive” and the other as “neutral” — the model will receive an ambiguous signal.
Low consistency:
- leads to a deterioration in the generalization ability of the model;
- increases the variance of the results;
- reduces confidence in the sample.
Consistency is often measured by inter-annotator agreement coefficients (e.g., Cohen’s kappa or Fleiss’s agreement coefficient).
Completeness is the presence of all necessary labels within the task. Annotation is considered complete if it reflects all significant objects, phenomena, or categories. If there are 5 objects in the image, but only 3 are labeled, the model simply “does not know” about the other two.
Insufficient completeness leads to:
- loss of information;
- reduction in the recall of the model;
- distorted estimate of the class distribution.
Example: in the project of recognizing road signs, missing even one sign can make the system less safe.
The QA Process: Step-by-Step Overview
Data annotation quality control is not a separate final step but a built-in system that operates at every level of the annotation process. Below is an approach that has been tested in practice in large projects, including Tinkogroup teams.
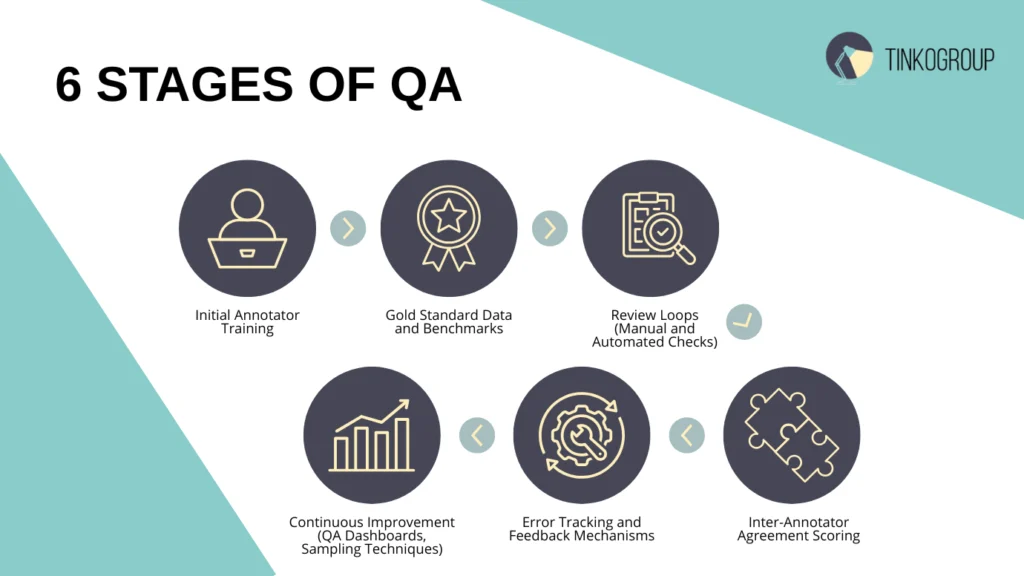
Initial Annotator Training
Before the start, each annotator undergoes training: they are given a set of 10-20 tasks with known answers (gold standard), they undergo a mini-test, and only after successfully passing are they allowed to do the main work. For complex tasks, training can take up to a week.
Gold Standard Data and Benchmarks
The creation of the gold standard is a key step. A separate team of experts with domain expertise usually works on its formation. This data is used both for training and for automated checks.
Review Loops (Manual and Automated Checks)
Each sample is double-checked:
- manually (by a senior-level reviewer);
- via automatic scripts based on logic or rules (e.g., checking for empty bounding boxes, overlap, conflict labels).
In Tinkogroup projects, reviewers check about 10–15% of the volume, using interfaces with marks based on error probabilities.
Inter-Annotator Agreement Scoring
The Kappa coefficient (Cohen’s or Fleiss’) is often used, especially when labeling complex texts or medical data. If agreement falls below 0.7, an internal annotation adjudication process is automatically initiated to resolve disagreements and maintain labeling consistency.
Error Tracking and Feedback Mechanisms
Errors are recorded in a separate system (e.g., Notion or Jira), and each annotator receives a weekly report with feedback. This reduces the annotator error rate by 15–20% during the first months.
Continuous Improvement (QA Dashboards, Sampling Techniques)
Teams use QA dashboards with annotation QA metrics graphs, track review/rework rates, conduct spontaneous reviews, and change the wording of instructions based on the behavior of annotators.
QA Metrics to Track
Annotation quality control is not just error checking. It is a systematic work that requires constant measurement and analysis of key metrics. To effectively manage the data annotation process, it is necessary to understand which parameters characterize the quality of annotation, how to measure them, and what exactly they say about the process. Below we consider the main annotation QA metrics that organizations use to assess ML data quality and improve data annotation quality in the long term.
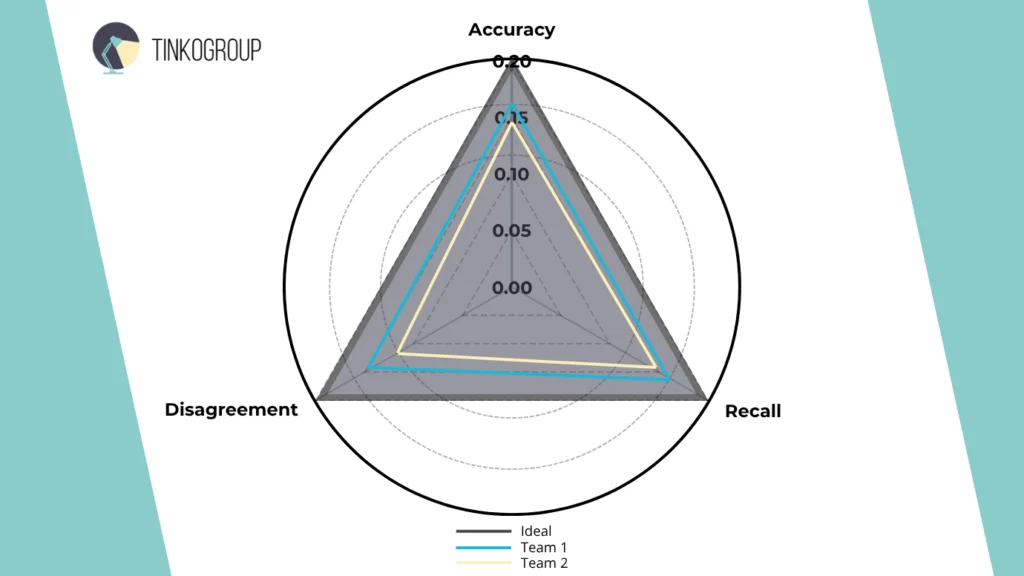
Accuracy Rate
The accuracy rate shows how well the annotation matches the predefined gold standard. It is usually calculated as the proportion of correctly labeled objects out of the total number. This metric is especially important in classification problems, where labels must match clearly defined classes.
For example, if the task is to label images of cats and dogs, and 950 out of 1,000 labels match the gold standard annotation, the accuracy rate will be 95%.
However, it is important to keep in mind that accuracy does not always reflect the overall situation, especially in unbalanced datasets. This is why accuracy should always be considered together with other metrics.
Precision and Recall
Precision and recall are classic metrics in machine learning, but they are also applicable in QA analysis. Precision reflects how high the proportion of truly correct labels is among all the annotations of a certain class. Recall shows what proportion of all real objects were detected and labeled.
For example:
- High precision and low recall — annotators label carefully but often miss necessary elements.
- Low precision and high recall — label almost everything, including unnecessary ones, but cover most targets.
In tasks where completeness is especially important (for example, in medical diagnostics), recall takes precedence. In others — for example, in advertising — preference may be given to precision.
Reliable Data Services Delivered By Experts
We help you scale faster by doing the data work right - the first time

Annotator Agreement Scores
This metric measures how equally different annotators interpret and label the same data. It is especially important when working with subjective categories — for example, emotional coloring of text or toxicity assessments. Tasks such as human-annotated sentiment analysis require particularly detailed guidelines and strong inter-annotator calibration to maintain consistency and reliable model training.
Annotator agreement can be measured in various ways:
- Cohen’s Kappa coefficient — shows how much better the matches are than chance;
- Fleiss’ Kappa — used if more than two annotators are involved in the task;
- Krippendorff’s Alpha is a universal metric for categorical, ordinal, and numeric data.
Low agreement may indicate:
- insufficiently clear instructions;
- subjective problem statement;
- insufficient level of annotator training.
In these cases, the annotation review process and standards must be revised.
Throughput
Throughput measures how many data units (e.g., images, text lines, video frames) an annotator is able to label in a certain period of time — usually an hour or a day.
It is important to understand that high performance is not always good. A sharp increase in throughput is often accompanied by an increase in errors. That is why throughput analysis is always performed in conjunction with quality metrics.
This metric is especially important when scaling data annotation services for machine learning, when tens or hundreds of annotators are involved. Managing speed and quality in such conditions is a strategic task.
Annotator Error Rate
Annotator Error Rate is the percentage of errors made by a specific annotator over a given amount of work. This metric helps to:
- detect insufficiently trained employees;
- monitor fatigue and burnout;
- provide individual feedback.
An error can be classified as:
- missing label (false negative);
- incorrect label (false positive);
- violation of instructions (e.g., incorrect format).
Organizations providing data annotation services usually use automated systems to collect statistics on errors and subsequently train the team.
Disagreement Rate
Disagreement Rate measures the frequency of inconsistent labels between annotators on the same object. Unlike the overall agreement rate, this is a coarser and faster metric that helps to identify conflicting cases or ambivalent instructions.
When the Disagreement Rate is above the threshold (e.g., 20%), it is a signal that:
- the guideline needs to be revised;
- additional training is required;
- perhaps the task itself is too subjective for mass annotation.
A high level of discrepancies significantly reduces data labeling accuracy and therefore requires the intervention of QA specialists.
Review/Rework Rate
Review Rate shows what percentage of annotations passed rechecking. Rework Rate — how many of them required revision or complete relabeling.
This is an important indicator of the maturity of the annotation pipeline. If the Rework Rate is consistently high (e.g., above 15–20%), this may indicate the following problems:
- insufficient training of annotators;
- task complexity;
- suboptimal labeling interface;
- lack of clear quality criteria.
The goal of any mature data annotation service is to reduce the Rework Rate to a minimum value while maintaining AI training data validation at a high level.
Common QA Challenges & How to Address Them
Even with a well-structured annotation process and quality control system, difficulties inevitably arise. Some of them are related to the human factor; others are related to the scale of the project or the specifics of the data. Understanding common errors and effective approaches to eliminating them allows you not only to maintain data annotation quality but also to optimize the entire process. Below, we discuss the most typical challenges and practical ways to overcome them.
In many projects, inconsistent review decisions occur not because guidelines are unclear, but because reviewers interpret them differently. Regular reviewer calibration sessions help maintain consistency and improve overall annotation quality.
Ambiguous Labels
Reason #1 for errors is unclear wording. Solution: revision of instructions, adding edge-case examples, and interactive glossaries.
Annotation Fatigue
After 3-4 hours, accuracy drops. Breaks, shift work, and gamification are used.
Scaling QA with Large Datasets
It is impossible to check 10 thousand tasks manually. Autoflags, active learning, semi-supervised approaches, and re-labeling of samples based on deviations in results are used.
Best Practices for Maintaining Annotation Quality over Time
Maintaining high data annotation quality requires not one-time solutions but a sustainable system. Below are key approaches that work in the long term.
- updating instructions every 2-3 months;
- using heatmap for errors in the markup interface;
- rotating annotators between similar tasks;
- mandatory calibration of new annotators through comparison with the reviewer;
- using external review once a quarter.
How Tinkogroup Ensures High Annotation Quality
Tinkogroup has a multilevel data annotation quality control system, including:
- its own QA team,
- tools for consistency analysis,
- feedback and rating system for annotators,
- integration of custom quality check scripts.
At Tinkogroup, we believe great AI starts with accurately labeled data. We offer top-notch data labeling and annotation services. Our skilled team guarantees precision and quality to power your AI. Let your machine learning projects move faster and run smoother with us!
FAQ
What types of annotation most often require manual control?
Bounding boxes, text classification, and audio time stamping are the three most sensitive to the human factor.
What percentage of tasks should be checked manually?
Optimally, 10–20%. The rest is covered by autoflags and analysis of samples with high disagreement.
How do you know if annotation is poorly done?
A sharp drop in precision/recall, an increase in the number of reworks, a decrease in consistency between annotators.