In computer vision and machine learning (ML) domains, terms related to evaluating the performance of models are becoming increasingly necessary. One of these key indicators is the mean average precision (mAP), which objectively assesses the performance of object recognition algorithms. This mAP metric allows researchers and developers to determine the accuracy of their models and compare different approaches in a single metric.
But what exactly is behind this term, and why is it so crucial in today’s technology? Below, we will explore how mAP ranking is formed, what factors affect its value, and the main difference between mAP and AP.
What is average precision (AP)?
Average precision score is a crucial metric for evaluating object recognition models’ performance. It measures the model’s classification accuracy, taking into account both positive and negative predictions. This indicator allows the estimate of how many of the detected objects are true positives and how accurately the model can identify objects of different classes.
Calculating the average precision score involves several main stages:
Ranking the results
After the model has detected objects in the images, the results are ranked according to the probability of belonging to a class. This allows you to create a list of detected objects in the order of their probability.
Calculation of precision and completeness
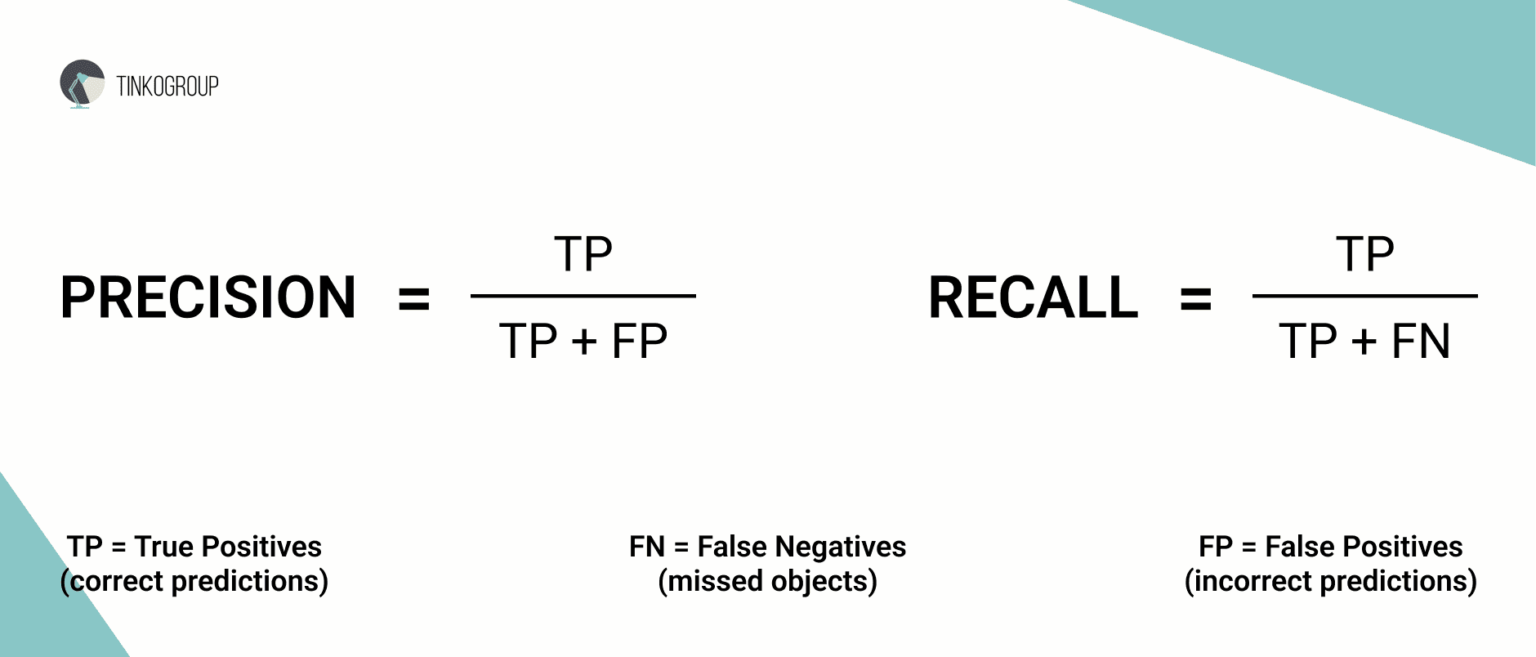
For each probability threshold defined in the ranked list, precision and recall are calculated. Accuracy is defined as the ratio of true positives to all optimistic predictions, and completeness is defined as the ratio of true positives to all true positives.
Construction of the PR curve
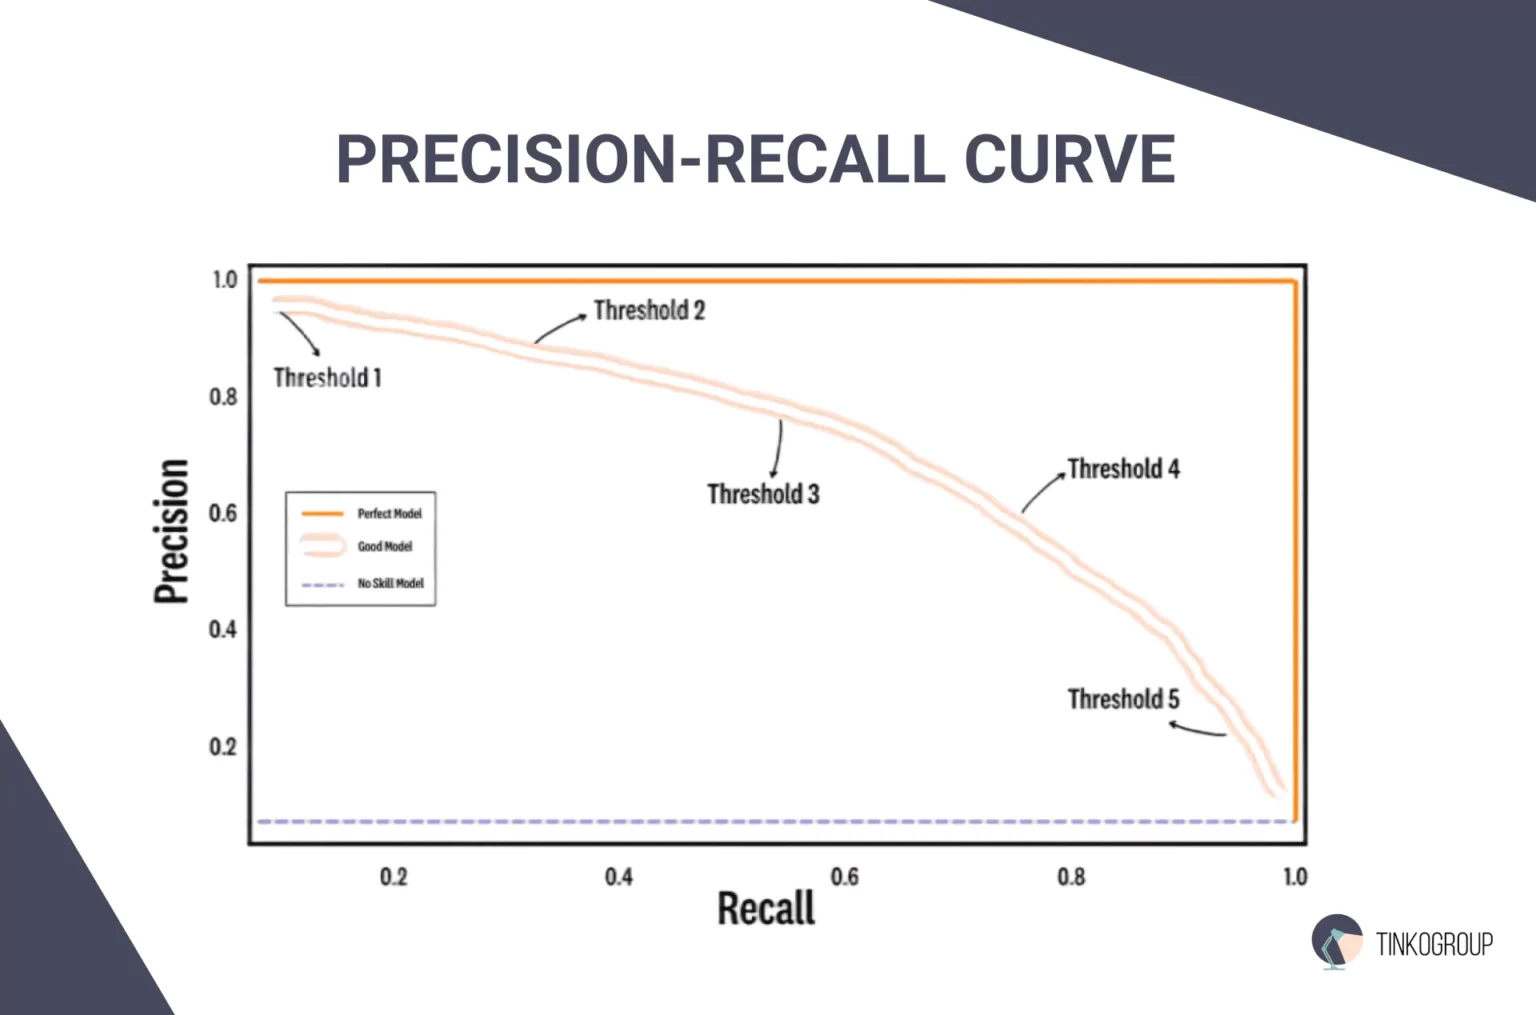
Based on the obtained values of precision and completeness, a precision-recall curve is constructed. This curve shows how the accuracy of the model changes as the level of completeness changes.

Calculation of area under the curve (AUC)
Average precision formula is defined as the area under the PR curve. This is a number ranging from 0 to 1, where 1 means perfect accuracy.
Use cases in object detection and other fields
AP is actively used in many fields, particularly in computer vision, where it serves as a criterion for evaluating object recognition algorithms such as YOLO (You Only Look Once) or Faster R-CNN. It allows researchers and developers to estimate the accuracy of their models and compare different methods.
Moreover, average precision score can be applied in areas such as information retrieval, where it helps evaluate the quality of search results, and in medical research, to analyze image data such as X-rays.
What is mean average precision (mAP)?
Mean average precision object detection is a generalized metric that combines the average precision values for several classes. It allows you to evaluate the performance of the model in the context of multiple objects, given that in most applications, it is necessary to detect not one but several classes of objects.
This makes mAP metric particularly useful in tasks where it is essential to have a balanced accuracy for all classes, such as in autonomous driving, where pedestrians, cars, road signs, and many other objects need to be detected.

Step-by-step breakdown of how mAP ranking is derived from AP:
- Calculation of AP for each class: First, for each class of objects in the data set, the average precision formula is calculated according to the previously described steps. This allows you to gain AP for all classes to be discovered.
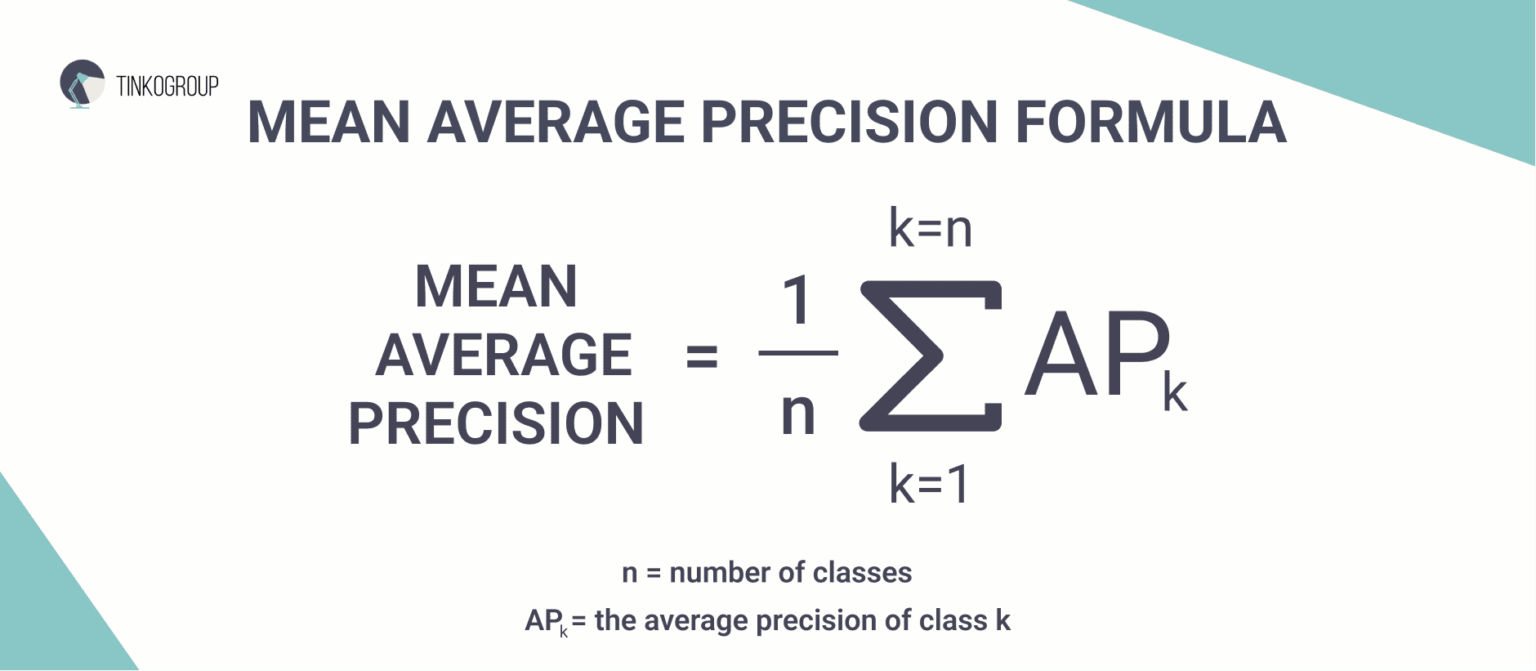
- Average: Next, to calculate the mAP, all the obtained AP values for each class are combined. This is done by taking the arithmetic mean of the AP values. For example, if you have three classes, the mAP will be (AP1 + AP2 + AP3) / 3.
- Generalized application: This process allows mAP to display the model’s overall performance on multiple classes simultaneously, providing a convenient means of evaluation.
Example of mAP in practice
Imagine you’re developing a model to detect cars, pedestrians, and road signs. For each of these classes, you calculate the average precision score:
- AP for cars: 0.85
- Pedestrian AP: 0.75
- AP for road signs: 0.80
Now, to calculate the mAP metric, you took the average:
mAP = (0.85 + 0.75 + 0.80) / 3 = 0.80
Thus, the resulting mAP value of 0.80 indicates that your model performs well in detecting objects in three different classes.
Key differences between mAP and AP
AP and mAP metrics are critical in the world of computer vision, especially in the context of object detection. Although both metrics serve to assess the performance of models, there are significant differences between them that can affect the choice of approach when developing and evaluating algorithms. Let’s consider these differences in more detail, using a table for ease of comparison.
Side-by-side comparison of AP and mAP
AP and mAP metrics have their unique aspects, and understanding their differences is critical to being successful in computer vision.
| Component | AP | mAP |
| Definition | Measures accuracy for one class of objects. | Summarizes accuracy for multiple classes. |
| Calculation | Calculated using the accuracy-completeness curve for one class. | Calculated as AP average for all classes. |
| Context of use | Used to analyze the performance of one particular class. | Used to evaluate the overall performance of the model on a set of classes. |
| Class sensitivity | Does not reflect the accuracy of other classes. | Includes the results of all classes, reflecting overall performance. |
| Importance | Important to understand the effectiveness of the model within one class. | Critically important for model quality assessment in multi-class scenarios. |
Focus on the “mean” in mAP and why it matters
The “mean” component of the mAP accuracy term is a crucial element, making this metric particularly valuable in situations where multiple classes need to be detected simultaneously. This average accuracy shows how the model performs, not just within a single class. Imagine a situation where the model detects pedestrians, cars, and road signs: each class’s AP can vary greatly.
A model may perform excellently in one class but poorly in another. Using a mean average precision formula allows developers to obtain a balanced performance score, essential for practical applications such as autonomous driving, where accuracy across all classes is critical to ensure safety.
Use cases where the distinction is important
In scenarios where multiple classes of objects need to be detected, machine learning mAP will be a more reliable performance metric. For example, if your model detects pedestrians, cars, and road signs, mAP will allow you to consider performance across all classes, not just one.
If developers are working on improving a model, mAP can help identify weaknesses by pointing out classes that need improvement. This is especially important in projects with a limited budget and time, where it is necessary to use resources as efficiently as possible.
When comparing different models, it is important to have a universal metric that reflects the overall performance. mAP metric helps to objectively evaluate which model performs better in the context of several classes.
For researchers seeking to create new object detection methods, mAP can serve as an important metric to test the performance of their solutions across a wide range of classes.

Reliable Data Services Delivered By Experts
We help you scale faster by doing the data work right - the first time

When to use mAP vs AP?
The choice between AP and mAP metrics depends on the specifics of the task, the number of classes, and the context of the model application. Let’s consider when to use these metrics and why they matter when evaluating the performance of your models.
AP applications
Average precision score is best used when your model targets decisions involving one or more objects, but you are interested in analyzing accuracy for each class separately. Below are a few scenarios where AP is the optimal choice:
- Individual class performance evaluation: If you are working with models that identify one type of object (for example, only people or only cars), AP clearly shows how well the model does with that particular class.
- Performance analysis in various environments: For example, in medical diagnostics, where a model may be trained to recognize specific pathologies, class-specific accuracy may be critical. In this case, AP will help to understand how well the model works with these classes.
- When the number of classes is small: If you have a small number of classes to detect (for example, 2-3 classes), AP can be a sufficient indicator to evaluate the model’s accuracy.
mAP applications
mAP ranking becomes a crucial metric when the model has to identify several different classes of objects, and it is necessary to have a comprehensive assessment of its performance.
Multi-class models
If your model works with several classes simultaneously, mAP will help you assess its performance overall. For example, in automatic object recognition tasks in photographs where cars, people, buildings, animals, etc. may occur, mAP allows us to evaluate how well the model performs for each of these classes.
Overall model quality evaluation
If you need to evaluate how well a model performs against different classes, the mAP machine learning formula allows you to do this based on the average accuracy for each class. This will help to get a global picture of performance.
Tasks where balance is important
If your model works in a context where uniform accuracy across all classes is important, mAP will be a more helpful tool. For example, the model must recognize people, vehicles, and other objects equally in video administration systems.

Common misconceptions
Average precision and mean average precision are essential in evaluating the performance of models. On the other hand, there is a lot of confusion and error associated with these metrics that can lead to incorrect conclusions about the quality of the models. Let’s analyze these misconceptions in more detail.
Addressing confusion between AP and mAP
The first and most basic notion that needs clarification is the confusion between AP and mAP metrics. Many newcomers to the industry believe that these two metrics are the same. AP measures the accuracy for one particular class of objects, while mAP is calculated as the average value of AP for all classes. This means that mAP metric makes it possible to evaluate the overall performance of the model in multi-class scenarios, while AP indicates the performance within a single class only.
It is crucial to understand that receiving a high AP value in one class does not guarantee a similar result in other classes. Therefore, reliance on AP alone may lead to incorrect conclusions about the overall performance of the model.
To avoid this confusion, you must always take into account what indicators you are evaluating and in what context. If you aim to optimize the model for handling multiple classes, then mAP will be a more informative metric than AP.
Clarifying frequent mistakes made when interpreting these metrics
Another common mistake is a misinterpretation of AP and mAP metrics. For example, some users believe that a high mAP value automatically means that the model is excellent in all classes. In fact, a high mAP accuracy can be achieved by very high scores for one or more classes, while scores for other classes may remain low.
This is especially relevant when the model can detect certain objects very accurately, while the accuracy remains unsatisfactory for different objects. Thus, it is crucial to look at the overall mAP value and the detailed AP metrics for each class to get a complete picture of the model’s performance.
Next common mistake concerns not understanding how mAP and AP affect model training. Some developers believe that improving the value of mAP can be achieved by simply increasing the amount of training data without considering the quality of that data. It is important to understand that while the volume of data may matter, the quality and distribution of data also play a critical role.
Suppose the training data is unevenly represented across classes. In that case, this can cause the model to detect only those classes with more examples, which in turn will negatively affect the mAP value.
The next error is related to the incorrect interpretation of test data. Some practitioners may assume that models that exhibit high mAP values on test data will perform equally well on new, unknown data. This can be misleading because the performance of models often varies depending on what data they are faced with. Therefore, testing on different data sets and accounting for performance variability is essential.
Conclusion
In general, the mAP computer vision metric is vital for developers, researchers, and analysts. It helps to evaluate models’ general performance and reveal the nuances of their functioning in different conditions. With mAP metric, we can understand which aspects of the algorithms need improvement, as well as determine the most effective approaches for solving specific problems.
Contact us if you want to implement innovative ML solutions in your business. Our professional company will help you reach new heights using advanced technology and deep analytical tools.
How to calculate mean average precision?
First, to calculate mean average precision (mAP), determine each class's average precision (AP) by plotting precision-recall curves and calculating the area under these curves. Then, compute the mean of these AP values across all classes to obtain the overall mAP score.
What is average precision?
Average precision measures an object detection algorithm's accuracy by calculating the area under the precision-recall curve. It mixes precision (correct optimistic predictions) and recall (finding all relevant instances) into a single score, with higher values indicating better model performance.
What is mAP in machine learning?
Mean average precision is a performance metric in machine learning, particularly for object detection. It averages the AP values for multiple classes, reflecting model performance across different categories while balancing precision and recall. Higher mAP values indicate better overall performance.


