


Every annotation vendor’s homepage reads the same way: promised quality, SLA commitments, and rigorous QA processes, with accuracy numbers reaching 98%. What’s usually missing is annotation quality evidence: documentation a buyer can actually check. If you’ve been through even one procurement cycle for a data annotation partner, you’ve seen this pattern enough times to stop reading it.
These claims are not necessarily dishonest. But very often, you cannot verify them. A vendor telling you they run a rigorous QA process may not be different from a vendor telling you nothing at all. On paper, the vendors appear nearly identical. Yet when the team asks for reviewer agreement reports, benchmark performance records, quality audit documentation, or examples of historical annotation outcomes, the conversation becomes noticeably less concrete.
Consider a familiar scenario. An ML team is evaluating three annotation vendors for a new computer vision pipeline. All three promise 98% quality. All three describe a multi-stage annotation QA process. All three claim enterprise-grade delivery. But when you ask for an annotation audit trail from past projects, only one vendor can provide anything beyond a sales deck. That’s not a coincidence but a signal about which vendor actually operationalizes quality versus which vendor markets it.
So, how can buyers separate evidence from promises? Annotation quality evidence becomes the real basis for vendor evaluation. Quality assurance evidence is not a claim. It’s a documented, inspectable record that lets you verify a vendor’s quality system the same way you’d verify a security system or a compliance framework. It includes reviewer agreement data, gold set performance, audit logs, and escalation histories.
This evidence matters because annotation errors don’t announce themselves. They surface three months later as a model that quietly underperforms on an edge case nobody flagged or a compliance gap nobody caught until an audit. A risk that regulated AI projects in healthcare or financial services can least afford.
SLAs fail as quality proxies. They rarely measure accuracy, reviewer consistency, or how well the vendor handles tricky cases. Organizations must shift from trust-based evaluation to evidence-based validation. They should ask for annotation quality evidence – records that prove a vendor’s annotation quality control can withstand real-world data complexity. This article gives a clear framework for what that proof looks like, how to ask for it, and how to judge it.
Why SLA Commitments Are Not Proof of Quality
Service Level Agreements, or SLAs, are common in enterprise AI programs. They detail what a vendor should deliver and usually measure project deadlines, response times, or project turnarounds. These agreements make vendors accountable and let projects stay on track.
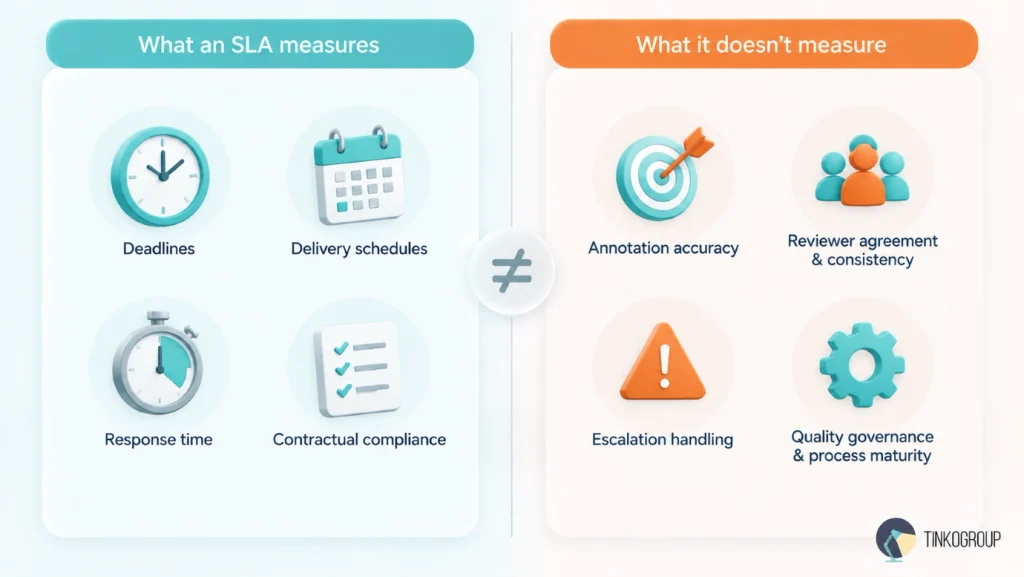
But SLAs have serious limitations for annotation vendor evaluation. SLA metrics do not measure what really matters for ML performance. They don’t prove the annotations are accurate or that the vendor is reliable. And they say nothing whatsoever about AI data quality once the labels reach your training pipeline.
The gap shows up differently depending on the use case. An autonomous vehicle perception dataset can hit every delivery deadline while missing rare object classes that only appear in a fraction of frames. An enterprise document processing project can clear its SLA on turnaround time while extraction fields are quietly misclassified in ways that only surface during a downstream audit. In both cases, the SLA report looks clean until the model or the compliance team finds the gap.
What SLAs rarely demonstrate
| SLA blind spot | Why it matters |
| Annotation accuracy | An SLA promising 98% accuracy but not explaining the measurement method is only a marketing number. Accuracy scores often come from tiny spot-checks or easy background data where errors are rare. They cannot tell you whether the vendor correctly labeled critical objects, rare edge cases, or complex domain attributes. |
| Reviewer consistency | An SLA almost never tracks inter-annotator reliability metrics, and this metric is one of the strongest indicators of a healthy labeling pipeline. If three reviewers produce three different interpretations, your dataset becomes noisy and inconsistent even if delivery speed is excellent. |
| Escalation effectiveness | An SLA measures how fast batches move through the platform, but it doesn’t show if annotators correctly flagged edge cases and routed them to domain experts. SLAs often have strict turnarounds, and workers simply have no time to ask questions. They guess to keep speed metrics high, burying ambiguity directly in your training data. |
| Quality governance | An SLA is a static snapshot. It will never tell you if the vendor tracks error taxonomies, updates guidelines, or runs targeted retraining when annotators slip. Real quality governance means proactively fixing the system that produces labels. Counting errors after the work is done is not enough. |
Why strong SLAs can coexist with weak annotation quality
Consider two vendors. Vendor A delivers every batch on time, responds to every email instantly, and completes projects ahead of schedule: flawless SLA performance. Yet, Vendor A also produces annotations with hidden errors. Their annotators are under-trained and uncalibrated. Their reviewers catch less than 30% of errors. They do only a single final check and naturally miss most issues. So, you reach all SLA targets with Vendor A, but your ML model degrades by 8% on validation.
Vendor B delivers projects slightly behind schedule, responds to emails within a business day, and rarely beats a deadline. Their SLA performance is mediocre. But Vendor B maintains a rigorous annotation review process. Every label they do is accurate and verifiable. You miss delivery targets with Vendor B, but your ML model improves by 5%.
Which vendor would you choose? The point is not that SLAs are useless. They establish baseline accountability and protect against catastrophic operational failure. The point is that SLAs are not a proxy for quality. They measure different things entirely.
A vendor can hit every SLA target and still produce flawed annotations that degrade your model. SLAs ensure the vendor shows up on time, but they do not ensure they show up prepared. It’s fine to reach for SLAs because they are concrete and enforceable. But your vendor evaluation process and contract should also include annotation quality evidence requirements. Annotation quality evidence provides the missing layer of vendor evaluation. It helps ML teams assess whether a provider’s quality controls produce measurable, consistent results rather than relying solely on delivery commitments and self-reported accuracy rates.
Annotation Quality Evidence ML Teams Should Request
The strongest signals of annotation quality are not process claims or accuracy percentages offered in isolation. They are records that show how quality was measured, how disagreements were resolved, how gold standards performed, and how the system responded when quality degraded. The categories below form a practical checklist for any serious evaluation.
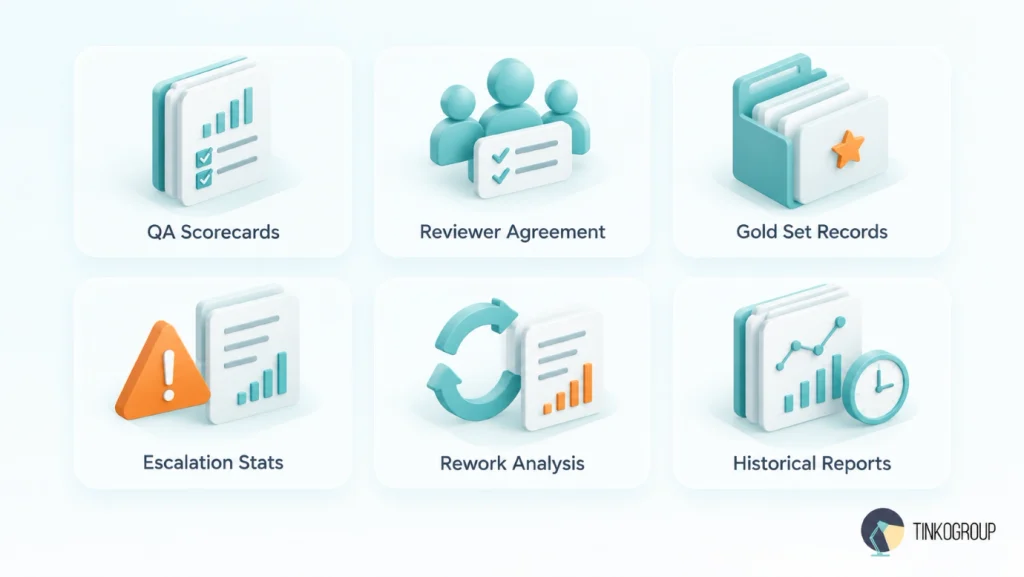
QA Scorecards
QA scorecards document quality assessment at the batch level. They should show the number of items reviewed, the sampling methodology, a detailed error taxonomy breakdown, pass/fail rates by batch, and trend data across project phases.
A scorecard demonstrates patterns, for example, lower quality for specific label types, inconsistent performance across reviewers, or declining quality under pressure. If a vendor cannot produce QA scorecards, they are either not measuring quality or are simply unwilling to share the results.
Expert tip: Request your vendor to provide QA scorecards from the last three completed projects of similar complexity to yours.
Reviewer Agreement Results
Inter-annotator agreement measures consistency across annotators. The industry uses Cohen’s Kappa metrics for two annotators and Fleiss’ Kappa or Krippendorff’s Alpha for multiple annotators. For sentiment or intent classification tasks, anything below 0.80 on Cohen’s Kappa is a risk signal. The threshold is lower for more complex taxonomies, but the vendor should know their threshold and be able to explain it.
Agreement results reveal whether annotators are interpreting guidelines consistently or introducing noise through personal variation. A vendor who does not track IAA is missing a key quality metric.
Expert tip: Ask how they measure their IAA threshold and request recent IAA reports.
Gold Set Performance Records
Gold sets are items with verified, unambiguous ground truth labels. Vendors should inject these into production workflows to continuously measure annotator performance. Annotators should not know which items are these. Gold performance metrics show if individual annotators maintain calibration and if guideline changes improve or degrade accuracy.
This is one of the few metrics that provides an objective measure of accuracy against known truth. A vendor cannot measure accuracy without a gold set.
Expert tip: Ask your vendor what their gold task injection rate is and what thresholds are. Ask to show their gold-set performance for the last 90 days.
Escalation Statistics
Escalation occurs when items are routed to senior reviewers or domain specialists for adjudication. Escalation rates reveal the ambiguity of your task taxonomy, annotator training effectiveness, and whether edge cases are being systematically routed or randomly assigned. Persistent or spiking escalation signals broken guidelines or inadequate training.
Escalation logs also document how disagreements were resolved and whether resolutions led to guideline updates. Without that tracking, reviewers may resolve similar cases differently.
Expert tip: Ask your vendor how often items require escalation, who reviews them, and how quickly they reach a resolution.
Rework Analysis
Rework measures how often delivered work fails quality checks and requires correction. Rework rates should decrease as annotators learn a task. Persistent or increasing rework signals problems with the process or guidelines.
Rework analysis should cover both volume and the error categories driving it. If completeness errors dominate, the gold standard is incomplete. If consistency errors dominate, guidelines need revision. When accuracy errors are the most prevalent, the workforce faces a quality problem.
Expert tip: Ask your annotator about their rework rate by project phase and the categories that cause most of it.
Historical Quality Reports
Trend data across multiple projects shows whether a vendor’s quality system works consistently or degrades under volume. One project at 98% accuracy is a data point. Twelve projects at consistent quality levels with documented methodology is a signal. Historical reports should show accuracy, IAA, escalation rates, and rework across projects of varying complexity and scale. This is the closest thing to a track record in measurable terms.
Expert tip: Ask your vendor to provide quality reports from your last 5-10 projects, including accuracy, IAA, and rework data.
Not every vendor will have every type of annotation quality evidence, and that isn’t always a concern. What matters is what is missing and why. A newer vendor likely lacks years of historical quality reports because they haven’t completed enough projects yet. That’s very different from an experienced vendor that has worked on hundreds of projects but still cannot provide reviewer agreement reports or QA records. The more experience a vendor has, the more annotation quality assurance evidence they should be able to share. These annotation quality metrics are what separates a documented track record from a sales pitch.
Evidence That Can Be Independently Verified
Not all documentation is equally reliable. A vendor-written quality summary is not the same category of evidence as a record that could, in principle, be checked by someone outside the vendor’s own team.
Independently verifiable evidence includes:
- Benchmark reports measured against a fixed, external standard rather than an internally defined baseline.
- QA audit results performed on a schedule and methodology the vendor can describe in detail, not simply summarize.
- Pilot project results from a live, observed sample project rather than a retrospective case study.
- Reviewer agreement records with sufficient granularity to show the actual distribution of agreement, not just a headline percentage.
- Historical quality reports that include multiple projects or clients, ideally with methodologies that allow for comparison over time.
Self-reported quality claims are always questionable, as it’s logical that vendors want favorable self-presentation. That doesn’t make them false, but it does make them insufficient as the sole basis for a decision. Annotation quality evidence is most valuable when buyers can independently verify the reported metrics, review the underlying methodology, and compare results across projects.
QA Artifacts That Reveal Operational Maturity
Theoretical QA workflows mean very little for vendor quality verification. Two vendors can describe an identical three-stage quality control process in their sales presentations. But their artifacts reveal which one actually operates the system they describe. The evidence of operational maturity is annotation QA artifacts. They truly show how a quality system functions when real-world data gets messy.
Annotation Guidelines
Good guidelines document a decision procedure, not only taxonomy. They tell the annotator what to do first, second, and third. They include examples with explicit explanations. They have a named tie-break rule for ambiguous cases. Sequence matters here too, because if two annotators apply the same rules in different sequences, they will produce different results.
Guidelines show how ready a vendor is to perform according to your instructions. A mature vendor treats guidelines as living do/don’t instructions rather than a static PDF.
Reviewer Alignment Records
Reviewers must use the same standards as annotators. Alignment records document reviewer IAA scores, calibration frequency, and disagreement resolution logs. If reviewers don’t agree with each other, the QA process doesn’t solve the problem. It just passes inconsistent decisions to the next stage. A vendor who can’t detail reviewer alignment may be running two inconsistent quality systems: one for production, one for QA.
Escalation Logs
Escalation logs document how a vendor handles edge cases: the item that triggered escalation, the disagreement, and the resolution, plus whether that case changed the guidelines. Without this tracking, reviewers may resolve similar issues differently, and the same problems keep repeating. Escalation logs show whether the vendor treats edge cases as learning opportunities or as obstacles to clear quickly.
QA Audit Reports
Vendors should run audits beyond their standard QA process, with larger sample sizes and more rigorous methodology than daily QA. Ideally it includes post-delivery audits that re-evaluate a random sample of completed work. Audit reports reveal whether the vendor’s standard QA process is actually catching errors or merely validating acceptable work.
Quality Dashboards
Experienced vendors track annotation accuracy, reviewer agreement, rework, escalations, and common error types on live dashboards. A vendor with a functioning dashboard can identify and correct issues in real time. A vendor without one discovers problems after they have already affected your data.
Error Tracking Documentation
Vendors should track errors by category, not only count them. Error categories include completeness errors (missing labels), accuracy errors (wrong labels), and consistency errors (disagreement between annotators). The dominating cluster determines your next move. A vendor who tracks only a total error rate can’t address the underlying cause.
For a legal AI document-review project, an insurance claims pipeline, or healthcare AI datasets feeding a diagnostic model. This documentation matters even more than in a low-stakes classification task. Since a missed clause, a misread policy exclusion, or a mislabeled scan carries direct financial, clinical, or compliance consequences.
How It Looks in the Real World
Consider two vendors describing their QA processes in a sales presentation.
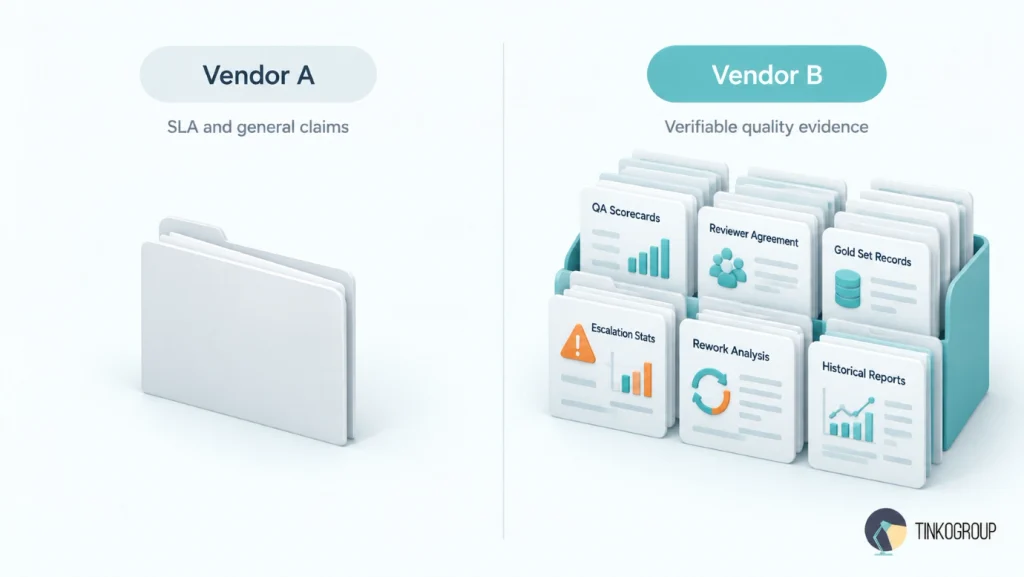
Vendor A: “We have a rigorous three-stage QA process. A senior annotator reviews every item, and we maintain 98% accuracy across all projects.”
Vendor B: “Here is our annotation guideline document for a similar project. You can see the decision procedure, adversarial examples, and tie-break rules. Our reviewer alignment records show our reviewers consistently score above 0.85 on Cohen’s Kappa. Our escalation logs from the last 30 days show 47 ambiguous cases and 12 resulting guideline updates. Here is our live quality dashboard, and here are our error-tracking reports with the corrective actions we took.”
Both vendors described the same three-stage QA process. One provided artifacts that prove the process exists and works, and the other offered only generic claims. The difference is in the annotation quality evidence that demonstrates operational maturity. Vendor B can prove quality. Vendor A can only promise it.
Benchmark Signals That Matter Before Vendor Selection
To evaluate vendors consistently, ML teams should compare annotation quality evidence across every vendor conversation, not only at contract signing. This is where many teams stumble because these benchmarks are easy to misread in isolation. Track these annotation quality metrics across every vendor conversation, not only at contract signing:
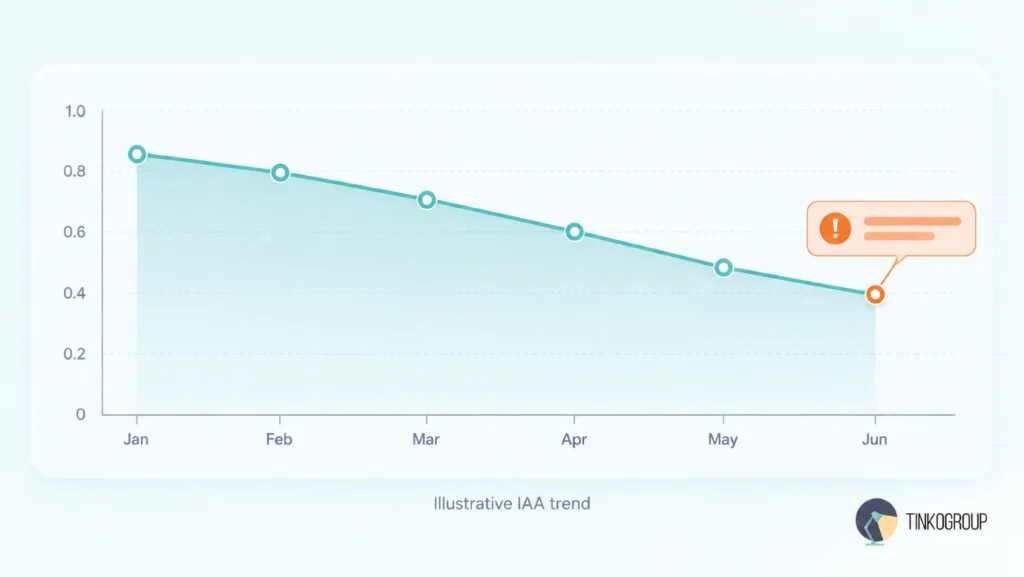
Inter-Annotator Agreement Trends
IAA trends reveal more than single data points. Consistent IAA across six months is a positive indicator. High IAA in month one that declines by month six signals drift, often the first warning of guideline issues or annotator fatigue. Vendors who track and share IAA trends demonstrate commitment to quality.
Gold Set Performance
The metric must specify the measuring method: F1, Cohen’s Kappa, or percent agreement. Gold scores reveal the annotation calibration quality and accuracy. A vendor without gold performance data cannot measure accuracy objectively. Gold sets are the only reliable check against reviewer bias. Vendors with mature quality systems check training data quality continuously and share the results.
QA Audit Outcomes
Vendors should be ready to provide audit sample size, methods, discrepancy rates, and error taxonomy. The gap between standard QA scores and audit scores is true annotation performance evidence. A narrow gap means the QA process works. A wide gap means the QA process misses systematic errors. Vendors who resist independent audits are hiding something. Audit readiness signals operational maturity.
Escalation Rates
A sudden increase may mean the guidelines are not clear. Very low escalation rates are not always a clear sign either, as they can indicate that reviewers are making assumptions instead of asking questions. A vendor should be able to explain why escalation rates change and what actions they take to address recurring issues.
Consistency reporting
It extends beyond IAA and includes consistency by annotator, by task type, and over time. It reveals whether problems are systematic or isolated to specific individuals or categories. An overall consistency score can hide weaker areas that more granular reporting would expose.
Metrics Without Context Can Be Misleading
Benchmark interpretation matters as much as the metric itself. Three common pitfalls can lead to bad decisions.
- Agreement rates without task complexity. 0.85 IAA on binary sentiment is very different from a 0.85 IAA on a 20-class taxonomy for, say, a financial services AI use case. The number of labels, class balance, and task subjectivity all shape whether a given score is actually good.
- QA scores without sample sizes. A 99% accuracy rate on a 100-item sample is not the same as 99% on a 10,000-item sample. A vendor who audits only a tiny fraction of work may be reporting a number that is not correct.
- Benchmark results without methodology. Accuracy targets are meaningless without a clear measurement method. Cohen’s Kappa and simple percent agreement produce different numbers on the same dataset. A vendor who quotes 98% on percent agreement may score in the low 80s on Kappa. You cannot compare vendor claims without methodology behind them.
Running a Sample Project to Validate Quality Claims
Documented evidence and historical benchmarks tell you about a vendor’s track record. A pilot project complements historical annotation quality evidence by showing how a vendor performs against your specific data, annotation guidelines, and acceptance criteria.
Most pilots fail because they test the wrong things. Vendors treat them as a demonstration, not as data annotation quality validation. They assign their best annotators, select the easiest data, and present polished results that are far from production reality. A good validation pilot should include:
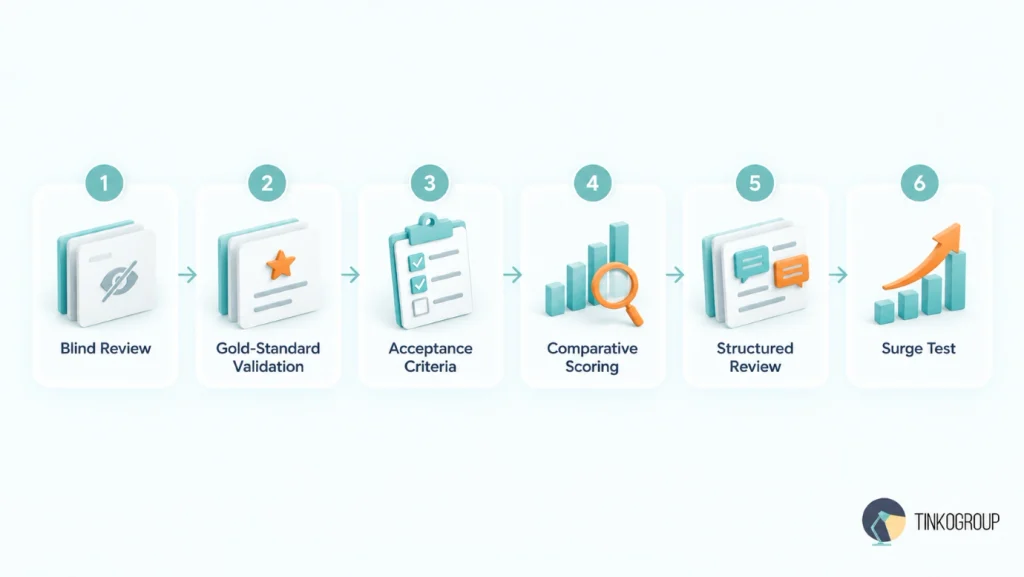
Blind review tasks, where the vendor doesn’t know which items are being evaluated, since performance improves artificially the moment annotators know they’re being tested.
Gold-standard validation. Before the pilot begins, build from 50 to 100 verified items covering both your most common cases and your most error-prone edge cases.
Acceptance criteria. Clearly define what you want the vendor to achieve. Specify the minimum IAA threshold, the maximum error rate, and the acceptable escalation range. Evaluation will not be objective without pre-defined criteria.
Comparative scoring. If possible, run the same pilot with multiple vendors. Comparative scoring reveals relative capability in ways that absolute scores cannot. A vendor scoring 92% when the average is 85% is different from a vendor scoring 92% when the average is 95%.
Structured quality review, where you audit a random sample yourself rather than relying solely on the vendor’s internal QA, so you can compare your findings against their reported scores.
A surge test. On the final day of the pilot, where the vendor delivers twice its normal daily volume. A vendor that maintains quality during a surge demonstrates that its capacity is genuine, not just staged for the audition.
What a Good Validation Pilot Should Measure
A pilot that only checks whether the final deliverable “looks right” wastes most of its value. It should show how the vendor adapts, communicates, and handles friction under pressure. Here’s what you should track during a pilot:
1. Reviewer consistency. Label quality should remain steady across different annotators and shifts. The variance across worker subsets shows whether the vendor maintains strong internal calibration or relies on a few star performers.
2. Escalation frequency. A complete lack of questions is often a red flag indicating workers are guessing to maintain speed. A healthy pilot yields clear, well-documented escalation queries that highlight genuine edge cases.
3. QA pass rates. Track how audit rates change as volume increases to see whether quality control holds at scale.
4. Rework volume. Shows whether the vendor fixes root causes or just patches obvious errors and introduces new drift.
5. Guideline adherence. Introduce a deliberate guideline change mid-pilot and check how quickly the operational team adopts it.
Pilot results provide far more trustworthy information than sales presentations. It’s a kind of stress test. If the vendor cannot meet your standards under controlled conditions, they will not meet them in production. The pilot is your best evidence, so use it to make decisions.
How Tinkogroup Provides Quality Evidence
Enterprise buyers should not have to rely on promises when selecting an annotation partner. They should be able to review the same annotation quality evidence that the vendor uses to monitor quality internally, and this is the approach Tinkogroup takes to annotation quality reporting.
We don’t treat quality as a final inspection before delivery. Our team monitors it throughout the annotation workflow. We continuously track reviewer performance, quality checks, and annotation results, so we identify and correct issues before they affect the final dataset.
QA reporting is a central part of this process. We don’t rely on a single accuracy percentage – we document how we measure quality across the project. Customers can review QA scorecards, reviewer agreement results, audit findings, and other records that explain training data validation.
Data pipeline auditing is another important element. All our annotation decisions are traceable. When difficult cases require additional review, escalation records show how we resolved them and what guideline updates or process improvements we made. This creates a documented history of quality decisions customers can review at any time.
Tinkogroup tracks reviewer performance over time and uses calibration and quality checks to keep annotation decisions aligned across teams. We always try to understand why errors occurred and prevent similar issues in future batches.
Benchmark tracking is one more layer of annotation quality evidence. We use reviewer agreement, gold set performance, audit outcomes, and rework trends to monitor quality throughout a project. These metrics make it easier to identify weak places, evaluate corrective actions, and demonstrate whether quality remains stable as the project advances.
Tinkogroup’s quality management process is built around documented evidence rather than assumptions. Instead of asking customers to trust quality claims, we provide operational records that support procurement reviews, technical evaluations, and training data governance. We let our customers clearly see how we measure, maintain, and improve annotation quality throughout the lifecycle of a project.
North American AI companies and European enterprises working with Tinkogroup increasingly treat this level of documentation as a standard procurement requirement rather than an optional extra.
Public case studies add another layer of evidence. Tinkogroup has achieved 95% annotation accuracy on a brand recognition project with 10,000+ images, 0.91 inter-annotator agreement (IAA) on an image annotation program that grew from 10 to 150 annotators, throughput that increased from 20,000 to 120,000 annotations per week, and a reduction in critical error rates from 3% to 0.7%. Other projects report 90% annotation accuracy for text labeling and 95% approval accuracy across 15,000+ product records.
Conclusion
The strongest vendors are not the ones with the most polished quality claims. They’re the ones who can prove those claims with documentation.
Most procurement conversations often miss one very important yet simple thing. They don’t ask for annotation quality evidence before discussing the SLAs. And a vendor’s response to that request is the most reliable signal available before you pass on your data and calculate the real budget for the relationship. Reliable annotation vendors do not send you their sales deck. They provide documentation that would hold up if someone outside their team tried to verify it.
The strongest sign of vendor due diligence is documented proof of past quality performance. Review this proof with the same scrutiny you would apply to a security review or a compliance assessment. Treat the evidence request as a non-negotiable step in vendor selection, not an optional add-on. The rest of the evaluation gets considerably easier from there.
If you want to build a repeatable procurement process, formalize the evidence request itself. Create a standard checklist that covers QA scorecards, IAA data, gold set results, escalation statistics, and pilot methodology. Then apply it identically across every potential vendor before you even touch on pricing or SLA terms. A vendor’s willingness and ability to satisfy that checklist are the best annotation performance evidence. It’s a clear signal predicting how they will actually perform once real data, real timelines, and real production stakes are on the line.
Ready to see what documented annotation quality looks like? Contact Tinkogroup right now.
What is annotation quality evidence?
Annotation quality evidence is documented information that demonstrates how a data annotation provider measures, monitors, and improves labeling quality. It includes QA scorecards, inter-annotator agreement (IAA) reports, gold set performance records, audit findings, escalation logs, and rework analysis. These records help ML teams verify quality claims rather than relying on vendor-provided accuracy percentages alone.
How can you verify a data annotation vendor’s quality claims?
Request recent QA scorecards, reviewer agreement results, gold set performance data, and audit reports from projects comparable to yours. Check the sample sizes, evaluation methods, error categories, and performance trends behind the reported metrics. A pilot project using your own data and predefined acceptance criteria can provide additional annotation quality evidence of the vendor’s ability to meet your requirements.
Why aren’t SLA commitments enough to evaluate annotation quality?
Service Level Agreements typically measure operational commitments such as delivery deadlines, response times, and turnaround. They do not necessarily demonstrate annotation accuracy, reviewer consistency, or effective handling of ambiguous cases. Combining SLA metrics with verifiable annotation quality evidence gives buyers a more complete basis for evaluating vendor performance and managing data quality risks.